Lecture 12 - OLS Regression (1)
Meta
![]()
![]()
![]()
Key Topics
ggplot2 ggthemes Plot Design R Regression RColorBrewer stats
Resources
Open on Open on Functions Lab-11 LaTeX
Lecture Slides
More on Plots
Line Breaks in Plot Text
We discussed this informally in class, and I wanted to clarify the technique for adding line breaks here. In situations where the size of the text has been increased or the quantity of text is quite large (a lengthy caption, for example), it is easy for the text to run off the sides of the plot. You can force a line break in text within ggplot2 using the \n operator:
library(ggplot2)

ggplot(data = mpg, mapping = aes(x = displ, y = hwy)) +
  geom_point(mapping = aes(color = as.factor(cyl)), size = 2, position = "jitter") +
  geom_smooth(method = "lm") +
  labs(
    title = "Fuel Efficiency and Engine Size \nof Consumer Automobiles",
    subtitle = "Select Vehicles Sold in the United States",
    x = "Engine Displacement (litres)",
    y = "Highway Fuel Efficiency (mpg)"
  )
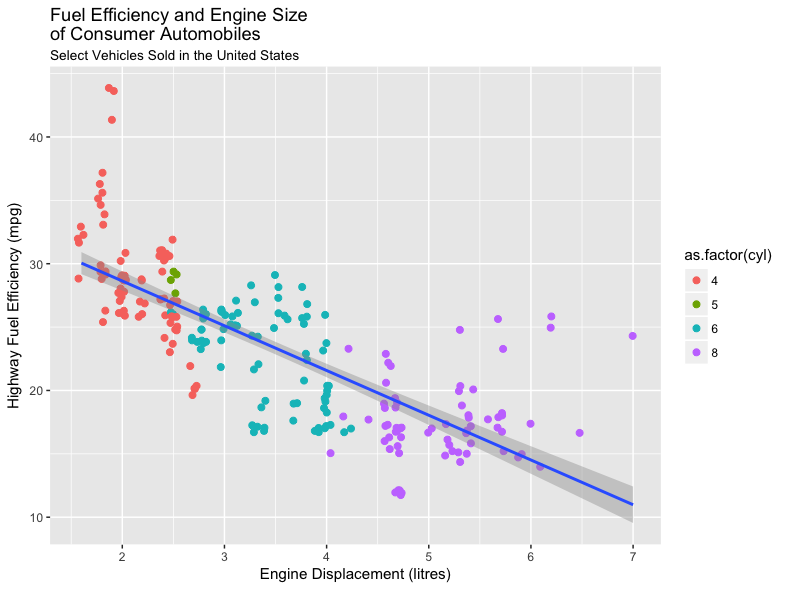
This example clearly does not call for the line break, since the text would not have run off the side of the plot. Adding the break here therefore only serves to sacrifice the amount of space that can be dedicated to the data themselves because it shrinks the available real estate for the main portion of the plot.