Lecture 08 - Difference of Means (Part 2)
Meta
![]()
![]()
![]()
Key Topics
broom car Cohen's D Difference of Mean Tests effsize ggplot2 ggridges ggstatsplot Power Analyses pwr R readr Reshaping Data stats tidyr
Resources
Open on Open on Functions Lab-07 LP-08
Lecture Slides
Tips for Working with Paired Data
The lab and the problem set for this week both include paired data, and you may run into a couple of issues that I want to hight.
Issues with Plots
The first issue that may arise is related to plotting data that are long. Following the examples from class, you may be tempted to use the year variable, unedited, to your plot. It will produce the following plot:
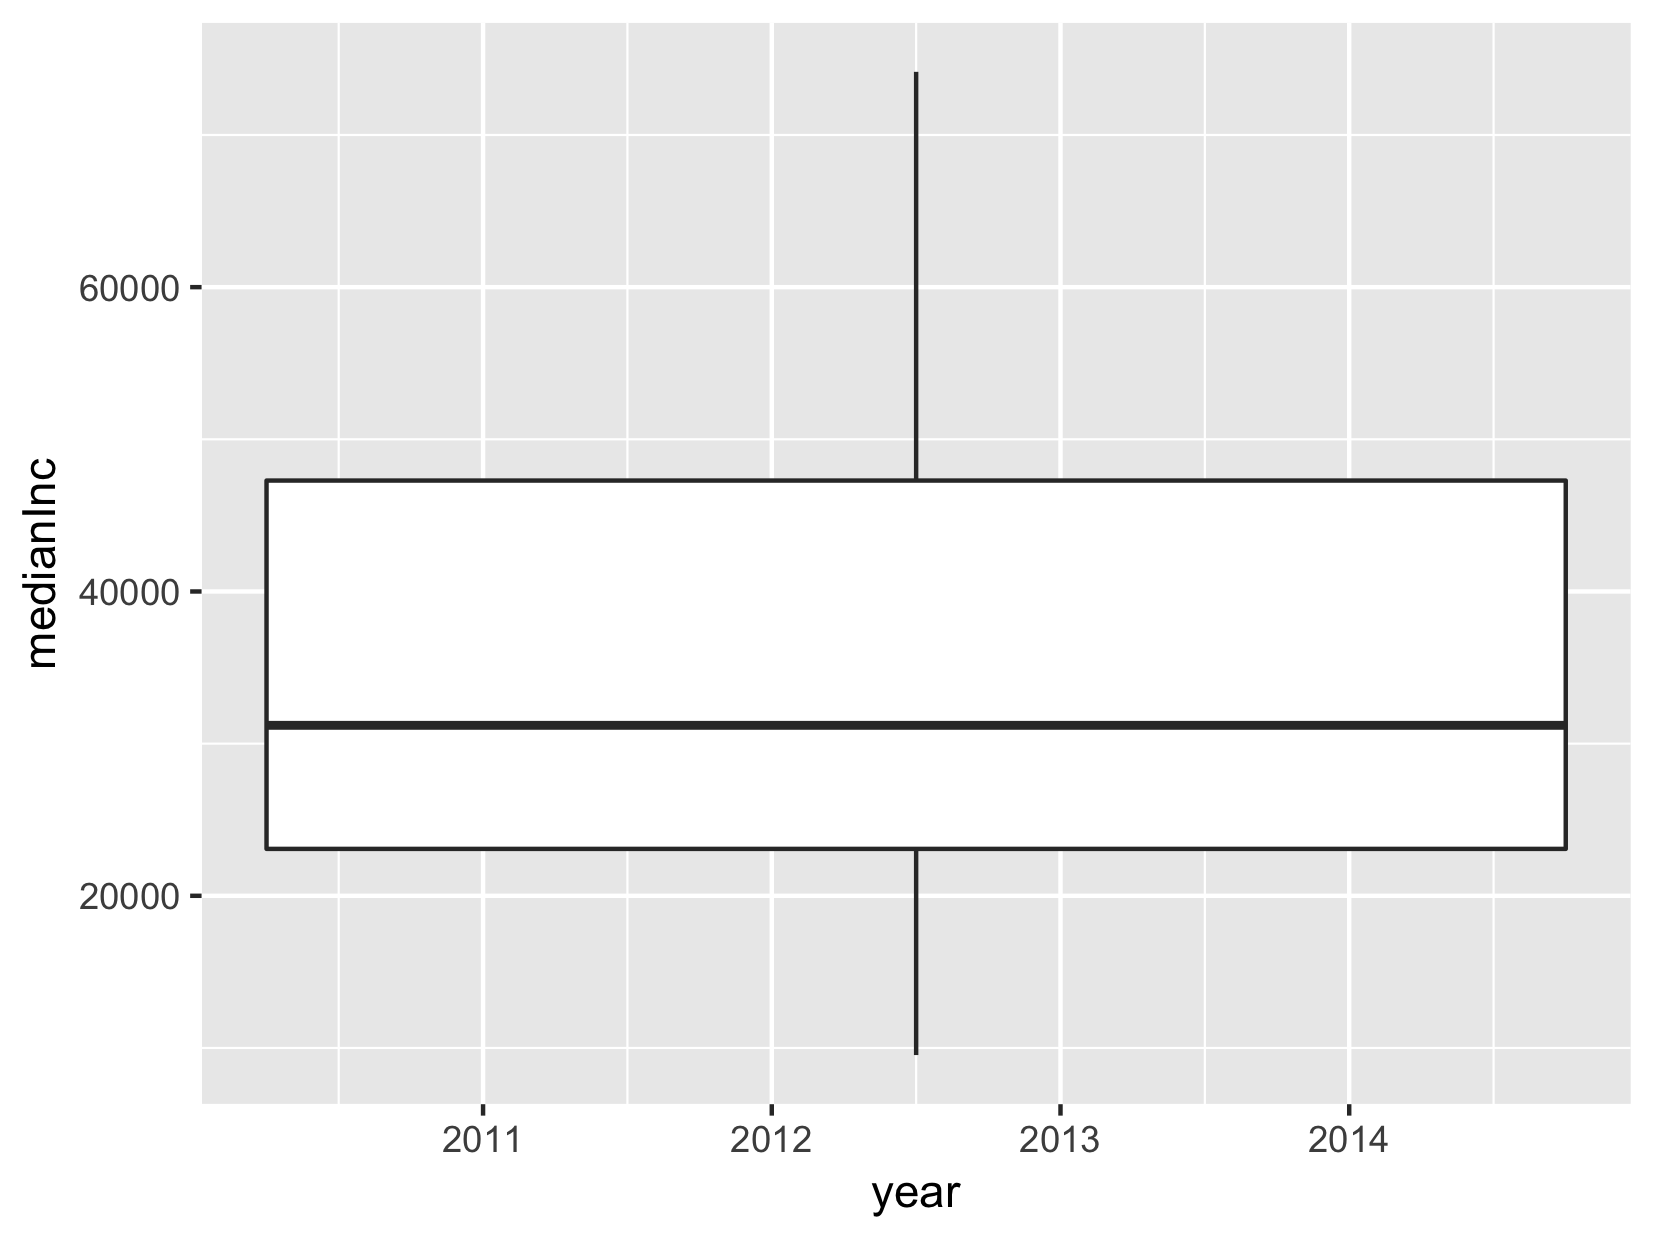
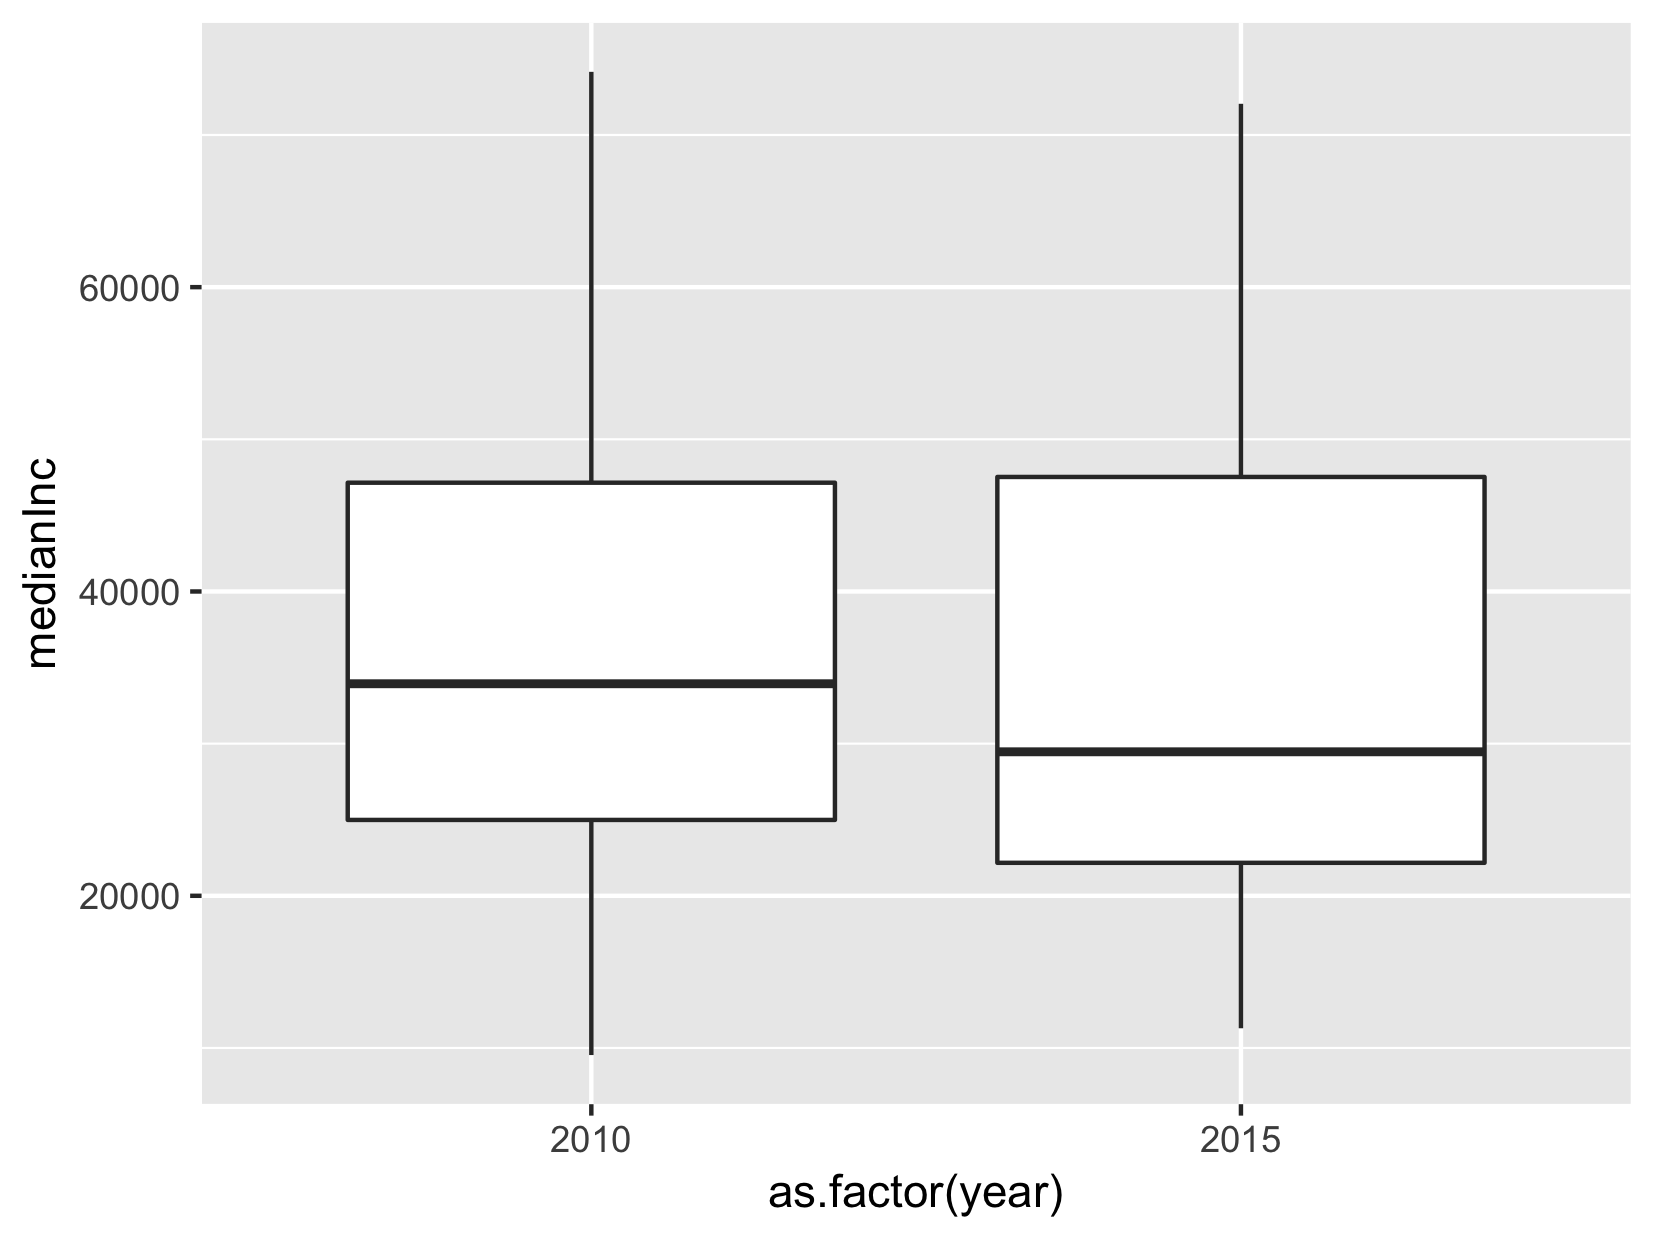
Even those we specified that year should be the x variable, it does not provide two boxes on the plot. This ibecause the x variable, year in this case, is numeric. To do this correctly, we need toeither (a) include a third option in our aesthetic mapping called group that is set equal to our year variable or (b) convert year to a factor or a string. Once we do, ggplot2 will produce the following plot:
Issues with Variable Names
When we convert incomeLong to incomeWide, the variable names become 2010 and 2015. Trying to call a function with these variable names (like mean(incomeWide$2010)) will produce an error. You must wrap numeric variable names in back ticks, like so:
mean(incomeWide$`2010`)
This will allow the code to execute properly.